Review on Zabbix by Mido Taylor

Great tool, helpful monitoring services
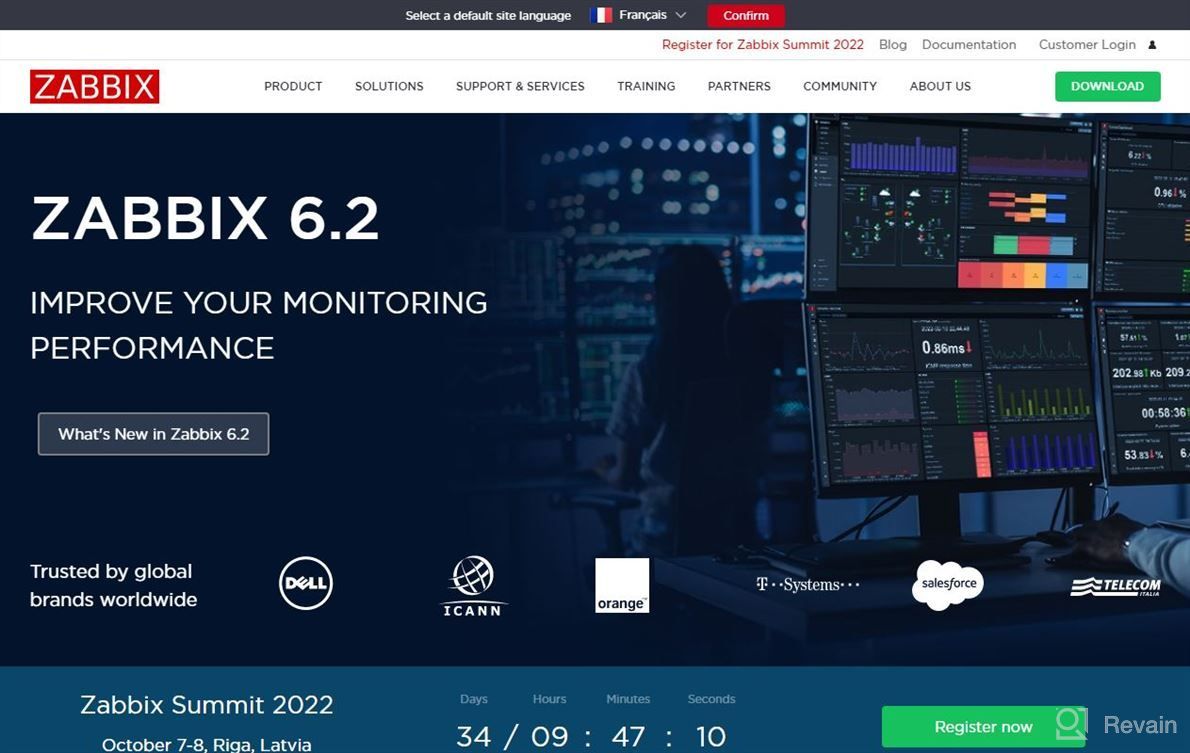
Easy setup - very simple configuration file format for different OS's (including windows). The fact that it can be used both as agent or server makes using this product easy even when you are not expert in system administration stuffs. Very handy dashboard which provides quick overview over all monitored parameters (although sometimes it seems like there could be more options available), also having graphs gives additional information about how much load each machine has received during last day/week etc. It would be great if charts were able to show data from previous time period so we wouldn't have to go through whole graph each year just to see what happened before. I'm solving problems related with providing statistics about server uptime and application performance.

- Monitoring works fine especially network infrastructure metrics but is good idea add some basic checks regarding local security issues i think.


