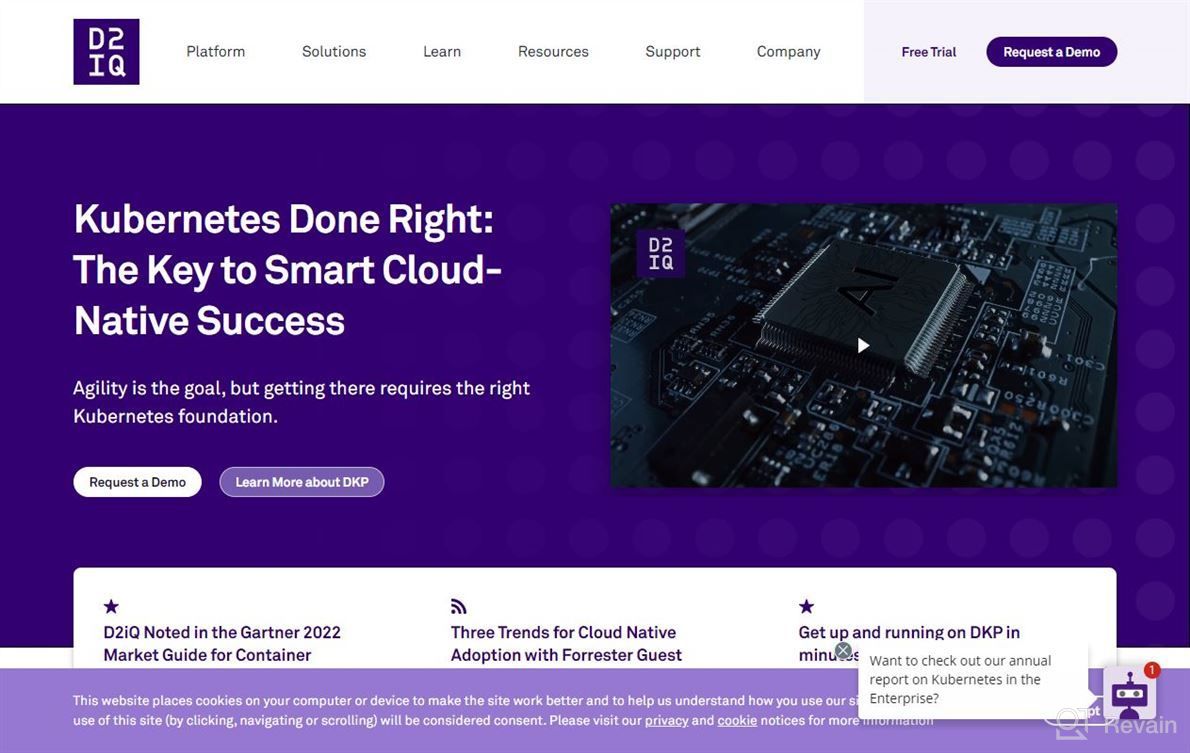
Review on D2iQ by Devon Holmes

Great resource for Kubernetes related support
I like that it's easy to set up using our existing k8s cluster as opposed to having your own separate Kube-Engine setup which is time consuming when you're trying out new stacks or have limited resources available (we are always looking towards continuous delivery). The dashboard makes debugging issues very straight forward with visualisations of both node health & application performance metrics etc all within one interface! It would be great if there was more information about what each metric actually represents - e.g., CPU usage could mean different things depending upon whether its an app running inside GKE vs local docker containers? Also not sure why we need two dashboards but this can't easily changed without rebranding everything so far no real downsides other than perhaps being able get too much info from 1 screen :) Would definitely recommend taking advantage of their free trial period where they.

- Nice friendly approachable staff who know exactly how customers want support solved at any given moment in order
- So-so


